We all know the theory which says that everyone should measure their PR activities. But not everyone knows how to get started in practice. That’s precisely where we come in.
As a technology company that offers solutions for the PR industry, every day we are in contact with literally thousands of professionals around the world. Be it through daily customer service-related activities, sales meetings, or simply relationship-building meet-ups. For instance, during our recent trip to London, we had the pleasure of meeting representatives of several local agencies and influencers. These meetings have confirmed our opinion that the number of discussions held (not only in Poland) over the problematic issue of measuring PR is disproportionate to the number of actual solutions available on the market.
When I think about measuring the effects of the mass distribution of press materials to different media outlets, I always recall an analogy our head of sales, Wojtek, once told me about. Imagine that you’re a sales rep and your task is to secure as many contracts with potential customers as possible. First, you build a funnel and get a reliable CRM. Then you measure the effectiveness of your activities based not only on the number of sales made but also on the sales activities that have led you to close these deals. These metrics will include, for instance, the number of potential customers which you managed to get in touch with over a given period or the analysis of the reasons behind the deals you lost, which you can use to improve the offer you’re working so hard to pitch every day.
There are many articles on sales reporting that can be used as an inspiration. See what the Pipedrive team suggests:
Now go back to your PR report in the context of generated publications and try to answer the following question: What relevant conclusions can be drawn from this report in terms of the activities planned for the next month?
This analogy is to show you that your actions are worth so much more than the amount of reach or advertising value equivalent your news managed to generate. And others should know about this too, as this is what actually makes your work more effective every single day.
If you’re using Prowly, the Account Performance tab lets you easily extract data concerning the actions performed prior to the release of your publication/mention of your brand or your client in the media. Such data may be turned into several simple metrics that can really jack up your standard PR report.
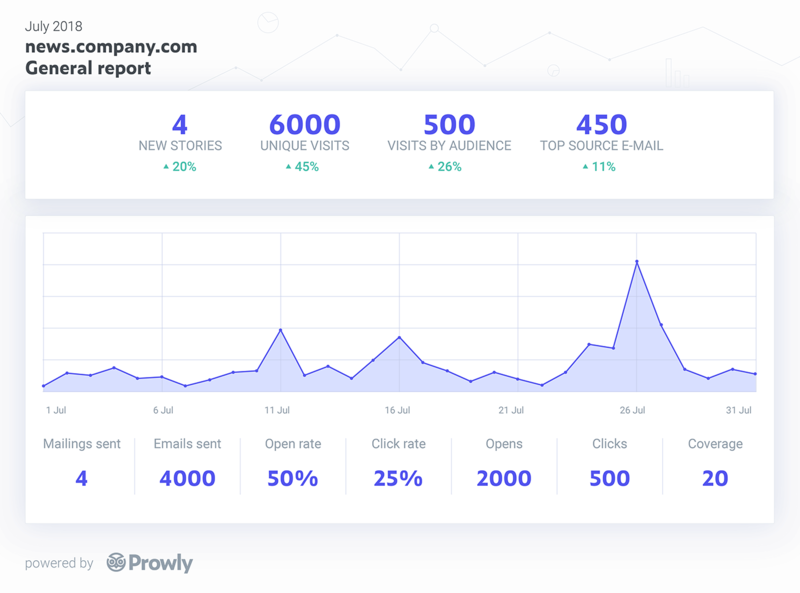
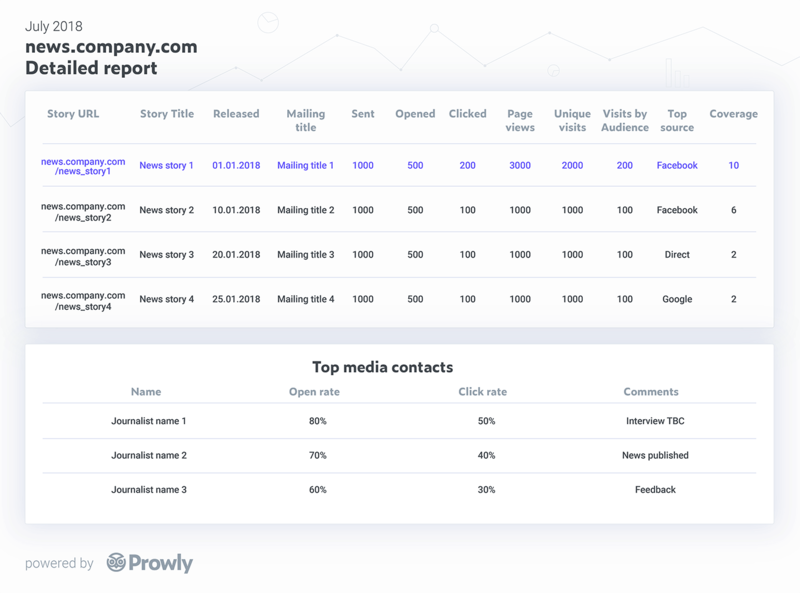
One example of such a report is presented above. In the downloads section, you can also find a template you may use to top off your own reports. The template comes in an Excel file and contains tabs that represent months and the main tab (M2M Summary), which automatically pulls the general activity stats from individual months, broken down by:
- Unique visits (to all your content pages within your Brand Journal on Prowly)
- Visits by your Audience (unique visits of all your contacts stored in the Audience module)
- Stories created (the number of stories created and published on your Brand Journal)
- Mailings sent (the number of mailings carried out using the Pitch module)
- Av. open rate (for your mailings)
- Av. click rate (for your mailings)
- E-mails sent (the number of contacts to whom mailings were sent)
- E-mails opened (the number of contacts who opened your emails)
- E-mails clicked (the number of contacts who clicked on the links attached to your press materials)
- Coverage (the number of publications generated in the media)
- Story of the month (the title of the story which was the most popular in terms of publication)
You will find the above statistics from the first spreadsheet of the discussed document in the form of charts, which will allow you to examine the effects of your activities over time (which is 12 months in this case).
The tabs for reporting activities in specific months can be used to store more detailed statistics (Detailed report section), which will be automatically summed up and included in your general statistics (General report section), and presented in the form of conversion. Completing the Top media contacts section will allow you to keep an eye on the contacts who have interacted with you the most in a given month.
We are extremely curious to know if such a way of reporting activities performed via Prowly will meet your expectations, which is why we will gladly hear all your opinion and comments. Perhaps in the future, it will become the foundation for designing a functionality for creating automated reports in Prowly. And we're so looking forward to hearing your ideas for how we could improve this template.
If you want to know more about Prowly, book a product demo here.


